Download the presentation of this section.
INTRODUCTION: methodology
First, identify the content you want to create (e.g Wind Energy) and the curricular characteristics: level, students age, subject etc. The content could be a sequence of lessons, a lesson or a topic.
Secondly, set learning objectives!
In our example the LOs are:
- Define alternative energy;
- Describe and evaluate the possible impact of wind mills;
- Understand the NIMBY syndrome;
- Interpret maps;
- Explain graphs;
- Describe, explain and evaluate possible influences on this location
- Finally, link case study objectives to the content of SDGs.
Thirdly, select key resources, useful links and embedded hyperlinks if appropriate for the lesson;
Examples:
ArcGIS online map https://arcg.is/1zqLrX0
Other websites: https://ourworldindata.org/renewable-energy & https://globalwindatlas.info
LEARNING STRATEGY
Note: Each case study has been divided into 6 main STEPS;
Each step might include also more than one of Rosenshine’s principles:
-
- Review
- Ask questions
- Practice
- Obtain high success rate
Teachers select the best combination of methods/steps/resources to succeed with this new pedagogical model and will design their own case studies;
The learning content should be divided into 6 main steps according to Rosenshine’s identified principles. You can skip 1-2 steps if you consider it unnecessary for the lesson/subject.
Step 0: Retrieval (e.g. quiz to check prior learning): start each lesson with a review of previous learning.
Suggestions: Kahoot quizzes, Q&A sessions, exercises, interactive worksheets;
For example, in our model, reviewing included questions on energy consumption and sustainable energy production, explanations of why renewable energy is essential and how renewable energy production has evolved over time. Teachers could use different resources too e.g https://ourworldindata.org/renewable-energy and check students’ understanding:
Check student understanding: Name three major renewable energy sources. List the five countries with the highest percentage of renewable energy.
Step 1: Direct instruction / teacher facilitated – schema building begins
The new content must be taught & learned in small steps. This could involve questions or explanations answered by students under the teacher’s guidance. Students work with digital notebooks or paper-based work.
Small steps/ Ask questions
Direct pupils to the Our World in Data website:
Go to https://ourworldindata.org/renewable-energy
-
- Study the map ‘How much of our primary energy comes from renewables? Which countries have the highest %, which countries are strong risers?
- Why are investments made in building wind turbines? What are the advantages of wind energy? Looking up information on the internet is allowed, but think critically about the sources you use.
- Are there any disadvantages to using wind energy? If so, what are they?
- What does the term NIMBY mean?
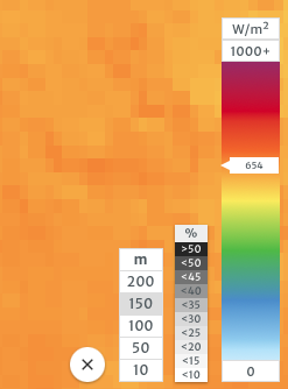
- Wind energy is not equally distributed; go to https://globalwindatlas.info and study the mean power density layer at different altitudes (you can look at different altitudes via the menu).
- Why do we need to generate renewable energy?
- What are the key elements of this resource?
Small steps/ Explanations
Go to https://globalwindatlas.info
The teacher provides direct instruction by explaining how to navigate on this website, pointing at how to get the info, sequence to make the most of this website
Exercises for students:
EX 1: go to https://globalwindatlas.info and study the mean power density layer at different altitudes (you can look at different altitudes via the menu).
Apply:
-
- Using the other layers, explain why one area might have more potential for the generation of wind energy than another
- Using the other layers, explain why one area might have more potential for the generation of wind energy than another
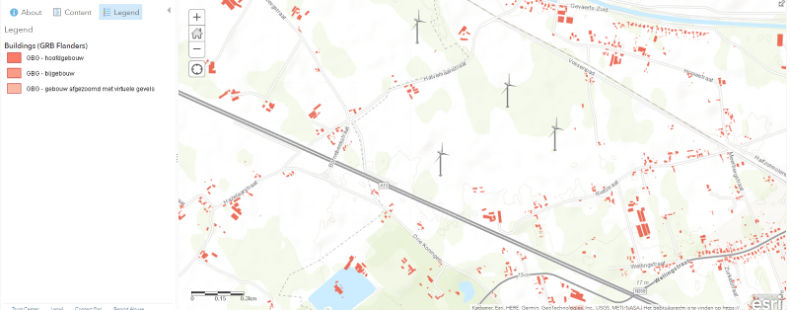
EX 2: Open the map on this link, which makes use of ArcGIS: https://arcg.is/1zqLrX0
-
- Click on Basemap and choose “Topographic”
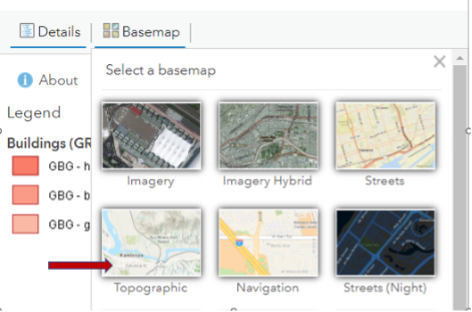
- Click on “Legend” to show the Legend

- See how the percentage of wind energy and the amount of wind energy are represented ( Zoom)
- Click on ‘Show table’
- Click on Basemap and choose “Topographic”
Small steps 2/ Ask questions
-
- The amount of wind energy is expressed in GWh. What does this stand for?
- Which country produces the highest amount of wind energy?
- Which country produces the highest percentage of wind energy?
- What is the difference between the amount of wind energy and percentage of wind energy?
- How does Belgium (or another EU country of your choice) score in terms of percentage of wind energy compared to Europe?
STEP 1 Instructional stages – Pedagogical Suggestions (for teachers)
| Instructional stages STEP 1 | Suggested activities |
| Introduce new material |
|
| Practice by asking a large number of questions |
|
Step 2: Modelling / Scaffolding Review and Questioning – what data are needed?
After presenting new content in small parts, the next step is modelling. Teachers provide models by showing students how to solve new lesson tasks on their own.
Example: Situation:
In the autumn of 2022, six windmills were scheduled to be built in the region between Beernem and Oostkamp in the Netherlands. These windmills were called ‘The Zesling’. Through a public enquiry, the population was informed, and eventually the permit was withdrawn because of too much nuisance for the people living in the neighbourhood. But was this decision correct?
TASK: You can use the web map to investigate. With the help of this step-by-step plan, you will investigate whether the siting of the windmills was disturbing for people living in the neighbourhood.
-
- If you were responsible for the siting of a wind turbine, what factors would you take into account? Where would you definitely not position a wind farm and where would preferable locations be?
- Have a look at the (off-line) site of ‘De Zesling’: https://bit.ly/de6ling (this is in Dutch but the graphics are clear enough)
- What criteria should the design of a wind farm meet?
- What is meant by a ‘cast shadow’?
- How loud can a wind turbine sound on the outside of a house in decibels? How does this compare to other sources of noise?
Obtain high success rate
Students must write down, or otherwise capture all of the information they retrieved as they will need it in the next steps!
STEP 2: Modelling & Scaffolding – Pedagogical Suggestions
| Instructional stages | Activities |
| Provide models – show students how to do the task |
|
SCAFFOLDING PEDAGOGICAL SUGGESTIONS
| Instructional stages | Activities |
| Instructions for individual learning |
Remove gradually your support |
| Independent practice |
|
Step 3: Individual exploration
In our case study model we have included an exhaustive step by step learning activity to guide students and to provide the tools needed for individual exploration. At the end, students create an overview with all arguments and their findings.
Guide student practice
In this part of the task you will use GIS to plan the windmills of ‘The Zesling’ and see if they would have caused any significant nuisance. Follow the step-by-step plan:
-
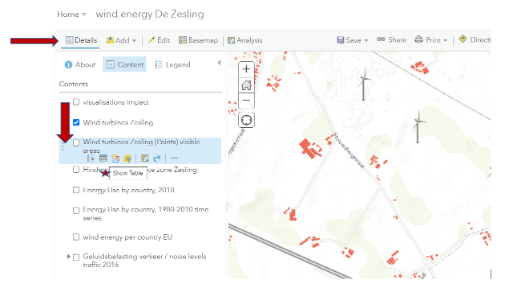
- Return to ArcGIS and this map which has been specially created for the course, and click CONTENT.
https://digitaleartheu.maps.arcgis.com/home/webmap/viewer.html?webmap=41c360a301f34a1190e38847fdb9e1fd - Make sure all layers are unchecked
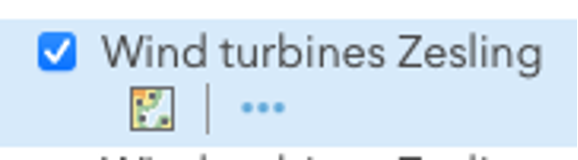
- Turn on the layer called ‘Wind turbines Zesling’
- What do you notice about the proposed locations?
- What is the impact of the cast shadow?
- The website of ‘De Zesling’ says how high the windmills are. Using the rules of trigonometry, determine the radius around the windmills that can cause cast shadows if you know that the sun makes an angle of 14.5° with the surface of the Earth during winter. For this problem, you may assume that the Earth is flat (which is certainly not the truth!)
- Click on the symbol under the layer ‘Wind turbines Zesling’ for analysis
- Click on ‘Use Proximity’ and then ‘Create Buffers
- At 1. choose your Map Notes card (points)
- At 2. choose ‘Distance’ and fill in your found radius.
- Click on options under 2. and choose ‘Overlap
- Give this layer a suitable name.
- Click on ‘Run analysis’.
- Zoom into the buffer zone until you see building outlines. If you do not see any buildings check that the Buildings map layer is ticked. (Bear in mind that the southern quadrant of the buffer has no shading.)
- Are there buildings in the buffer zone? If yes, approximately how many?
- Take some screenshots – one option is using ‘Print’ – ‘Map’ – so that you can use them later in your newspaper article.
- What is the noise impact?
- What is the noise level of the wind turbines? (to be deduced from the documentation)
- Compare with other noise impacts – what do you notice? Again, take some screenshots.
- Finally we will have a look at the visual impact of the turbines.
- Return to ArcGIS and this map which has been specially created for the course, and click CONTENT.
The project has created some visualisations that simulate the impact of the wind turbines in the landscape. To do this, turn on the layer ‘visualisations impact’.
Using GIS, viewsheds can be calculated to show areas where observed objects, such as towers and turbines can be seen, or, conversely, to show areas that can be seen from specified objects, such as church towers.
When performing this type of analysis for wind farms, you need to decide whether to compute the viewshed for the object from the tip of the rotor blade when it is in the most upright position, the rotor (which the blades are attached to), or some other part of the turbine. Your decision will have an impact on the viewshed analysis results.
-
- In the Perform Analysis pane, click Find Locations and click ’Create Viewshed’.
- In the ’Create Viewshed’ pane, set the height of observer locations to 150m – this is the height of the objects that will be observed which, in this analysis, are the wind turbines.
- Set the Height of other objects on the ground to 1.8 metres, this is the height of the observer, so you will assume the average height of the people who will be viewing the turbines is 1.8 metres.
- Set Maximum viewing distance to 15 kilometres; For the Create Viewshed tool, the optional Maximum viewing distance parameter is related to the resolution of the data used in the analysis and determines the extent of the viewshed. When the maximum viewing distance is less than or equal to 5 kilometres, and for areas where it is available, 10-metre resolution data will be used.
- If the maximum distance is greater than 5 kilometres but less than or equal to 15 kilometres, and where it is available, 30-metre resolution data will be used. Otherwise, if the distance is greater than 15 kilometres, 90-metre resolution data will be used. The maximum allowable viewing distance is 50 kilometres. As we use 24-metre resolution a distance of 15 km is ok.
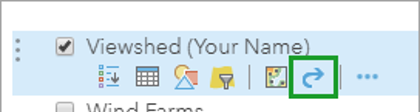
- Change the result layer name to Viewshed and add your name or initials to make it unique in the organisation.
- Click Run Analysis.
- The viewshed you created identifies the areas that can be seen from the tops of the turbines and, conversely, areas from which the tops of the turbines can be seen.
To see how the viewshed analysis varies depending on the assumptions you make, you’ll compare your results with those of a second viewshed generated for the base of the turbine towers. - In the Contents pane, point to the Viewshed yourname layer and click the Rerun Analysis button.
The Create Viewshed tool opens with the settings from the first time you ran the tool. You’ll change the settings to create a second viewshed.
STEP 3 Individual exploration PEDAGOGICAL SUGGESTIONS
| Instructional stages | Activities |
| Guide practice |
|
| Check students’ understanding |
|
| Obtain high rate success |
|
Step 4: Review – discussion
Suggested discussion to check student understanding
Think about your results for a moment. Do you think the people of Oostkamp and Beernem are happy with the arrival of the windmills?
Does the NIMBY syndrome apply here? Why? Why not?
STEP 4 Review – discussion PEDAGOGICAL SUGGESTIONS
| Instructional stages | Activities |
| Review |
|
Step 5: Problem-solving
Exercise: Write a short newspaper article (text 0.5 – 1 page) based on your results in ArcGIS and your research in step 4:
- Give a substantiated view on the problem of wind turbines: what are the pro’s and con’s of their installation. Which issues are not (sufficiently) taken into account, …
- Add at least one figure from your ArcGIS results. This figure does not count towards the length of the newspaper article.
- Indicate at the bottom of your article on which sources you have based your research on, this also does not count towards the length of the newspaper article.
STEP 5 Problem-solving PEDAGOGICAL SUGGESTIONS
| Instructional stages | Activities |
| Problem-solving |
|
Step 6: Presentation/Assessment (including peer assessment) sharing of outcomes
- Key question(s) to check student understanding…
- Why is renewable energy essential
- Why is not everywhere the implant of wind mills possible
- What about the NIMBY syndrome
- Invite student suggestions (e.g. think-pair-share).
- What are your findings on this specific case?
- How would you deal with it
- As a local inhabitant
- As a local government official
STEP 6 Presentation/Assessment PEDAGOGICAL SUGGESTIONS
| Instructional stages | Activities |
| Reviews/ Assessments/ present outcomes |
|
| Weekly and monthly review |
|